Introduction to Audio Storage
Sound
Sound moving through the air is composed of small changes in air
pressure that move rapidly (at the speed of sound, 1,230 km/h at sea
level) out from the source. In our ears there is a small membrane
and a set of bones that is capable of sensing these tiny (and very rapid)
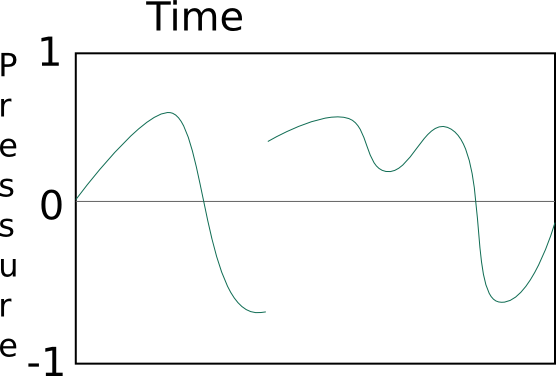
changes in pressure. Here is a graph of what the pressure
recorded near by a set of hands clapping one time looks like. This sample was
recorded by a microphone over 5/100ths of a second or 0.05
seconds. To listen to the
audio file, save it to your computer and
open in VLC or Audacity:
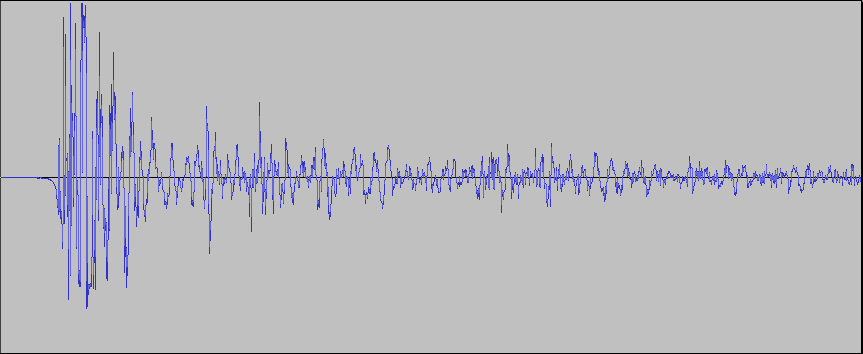
As you can see in the above graph (called a "waveform"), a sound that
we think of as one instantaneous event, is
actually composed of several different changes in pressure.
Spikes above the middle of the graph indicate higher pressure and
below the graph indicate lower pressure. Areas where the curve
goes further away from the center of the graph (both higher and lower)
are loud. Areas where the curve stays close to the center are
quiet. In this graph the loudest part of the clap is at the
beginning, then it trails off over time (remember the entire graph
above is only 5/100ths of a second).
We used a microphone
to record these changes in pressure. A microphone has a component
that is susceptible to tiny differences in pressure (like a very small
balloon) and couples that with a component that can change the amount
of electrical voltage moving through a circuit. There are many
different methods for doing this, but the end result is that all
microphones convert the changes in pressure that pass over them into
changes in electrical voltage that can be sent down a wire into a
recording device, in this case a computer.
Sound generally
doesn't move any air, it simply compresses/decompresses it to
higher/lower pressure for a split second at a time. Because of this, the pressure
changes above and below the curve must balance out. Each time the
pressure goes through all the phases: go up above the curve, come back
down to the curve, continue down below the curve, and finally come back
up to
the curve; making one complete loop, this is called a cycle. The
number of cycles per second
that the sound does this is is called the rate or frequency, the unit for which is
Hertz, abbreviated Hz. So if a particular sound is at 500 cycles
per second, we call that 500Hz. We can also use the standard
metric prefixes for it. A sound at 31,000 Hz could be written as
31kHz. Just for a reference, the human ear can detect sounds from
approximately 20Hz up to 20kHz.
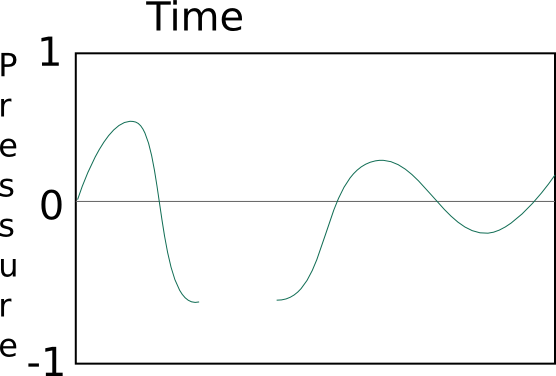
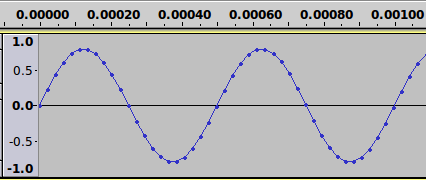
The way we hear the frequency is as different tones. It is
possible that we will have a tone with only a single frequency.
An example of that is below with a 2kHz frequency and the length of the
graph is only 0.01 seconds long:
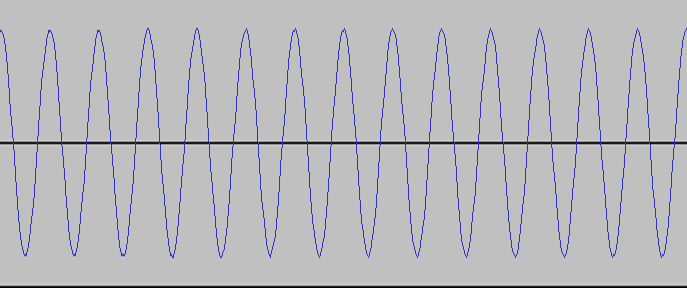
As you can see, it takes exactly 1/2000th of a second for the wave to
go from the center up, all the way down, and back to the center.
Here is a longer example of the same
sound to listen to (save it and open it in VLC or Audacity). You
can see that this pure tone sample is a lot different than the clap
example above. This is because, most sounds that we hear aren't
exactly one frequency, but rather a mixed-up jumble of frequencies that
we hear all together. What happens is we'll hear thousands of
different frequencies each second, each for a very short amount of
time. The way this happens, it that the waves of the frequencies
will either work together to make that particular part stronger, or go
against each other to make a part weaker.
Below are two sounds, 2.333kHz on top and 2.000kHz in the middle, which,
when added together, make the sound on the bottom:
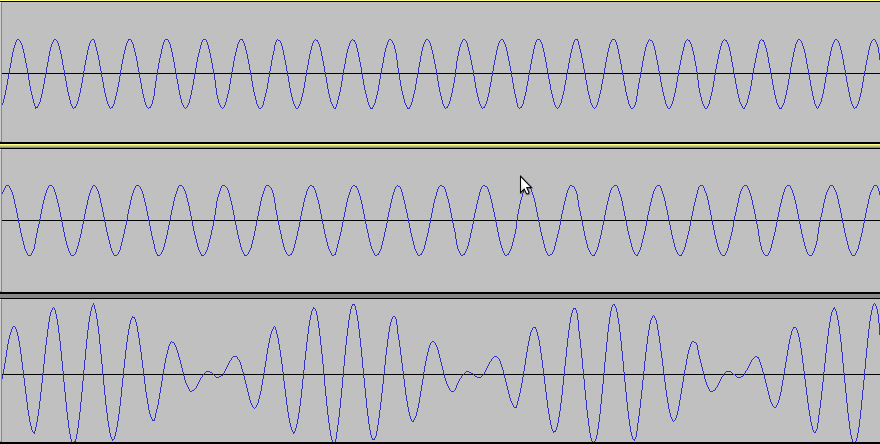
You can see in this image, that where the high and low parts of the
wave are together and line up, the waves get bigger. Where they
don't line up, they cancel each other out, and become smaller.
This audio file will play all
three tones, first 2.333kHz, then 2.000kHz, then the combination of
both. By combining the correct sets of frequencies, for the
correct duration, you can make any sound imaginable.
As we saw before, when we combine different frequencies, it changes
the height of the waves, this height (both positive and negative) is
called the amplitude, and represents how loud the sound is, also known
as its intensity. The
higher the waves go, the louder or more intense the sound you will
hear. This
scale is generally measured in decibels (dB). They range from
zero (0dB) being the quietest sound perceptible to the human ear (at
1kHz), to 194dB being the loudest sound that is possible to create in
the earth's atmosphere. Some examples in between: calm breathing
10dB, a normal
conversation 40-60dB, TV at a normal level 60dB, a busy roadway 85dB, a
jack hammer 100dB, a jet engine 130dB, and a rifle being shot
160db.
Warning on hearing damage:
Loud sounds, especially when heard
over periods of time, can permenantly damage part of the human
ear. If you spend long periods of time (8-10hrs/day for 6 months)
near a busy roadway (85dB) or if you spend even a few minutes near a
jet engine (130dB), you could do serious, permant damage your hearing.
To see an example of how the different intensities of sound show up on a graph, lets look at this
audio track,
from the trailer for the open source movie sintel, in audacity.
As it plays, you can see that the louder parts show higher peaks (and lower lows) on the
intensity scale. If you want to watch the video that goes with it
first, you can get that here.
Pulse Code Modulation - Wave Properties
When sound waves, or waves of change in air pressure, move through
the air, they always vary smoothly. There are never any
instantaneous jumps in pressure, just smooth changes in pressure that
can happen in incredibly short amounts of time. If we zoom in to
a small enough time, there will always be a nice and smooth curve, like
the last few above. Mathematically this is called being continuous
(in both time and frequency).
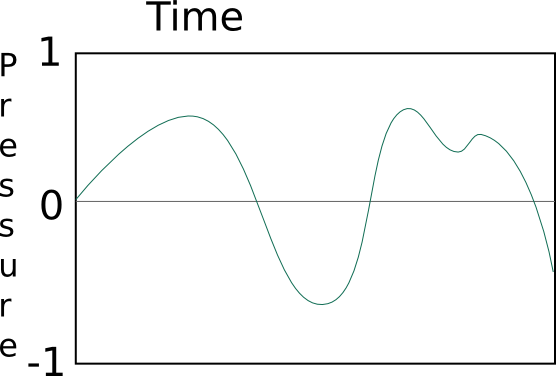
For example, this is a possible (even typical) graph of sound:
This is impossible, the pressure can not instantaneously jump from
one value to another:
This is impossible, there is always some amount of pressure (even if
that amount is zero), it can never not be there:
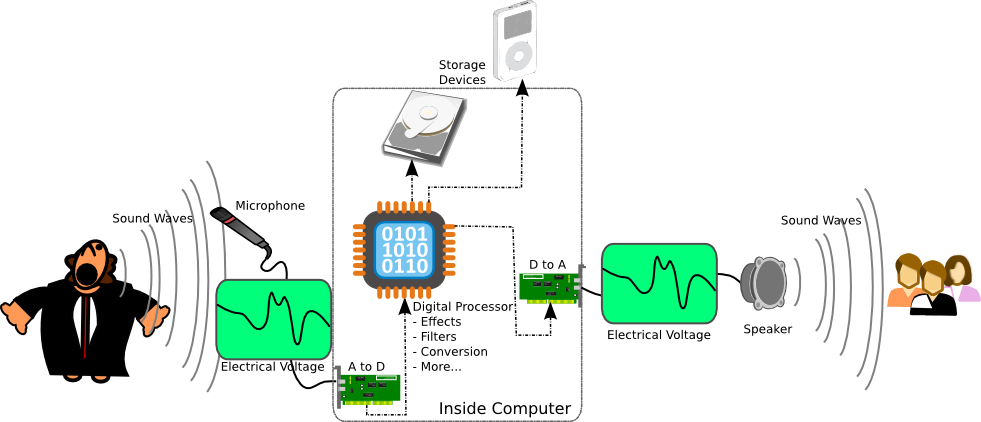
Analog to Digital Conversion
When we make an analog recording of a sound, say on a cassette tape
or vinyl record, we are recording the change in voltage output by the
microphone of the continuous changes in the pressure. However,
digital devices (Compact Disc (CD), computer, cell phone, etc.) are not
capable of storing this continuous data. For a digital device,
everything must be broken down into numbers (ones and zeros). So
the digital device can record a number of the amount of voltage put off
by the microphone. The catch is that it can't do it at every
instant, it has a limited number of times per second that it can make a
reading of the voltage and record its value as a number. The
general term for this is an analog to digital conversion (A to D, A-D,
ADC).
Luckily
modern electronics are very powerful, and can easily do one of these
analog to digital conversions many thousands of times every
second, each individual conversion being called a "sample". In
fact they are capable of recording so fast that the
human ear can't even tell that is was ever made into a digital
signal! The same thing happens when we play digital audio back
out. The digital device does a digital to analog conversion (D to
A, D-A, DAC) to
get the voltage numbers stored back to actual voltages of
electricity. Then the voltage travels to a speaker (or very small
speakers in headphones) which uses the change in voltage to run a
device that can make rapid changes in air pressure...and we hear
sound. These analog-to-digital and digital-to-analog conversions
are absolutely essential for audio, but can also be applied to lots of
other things as well. In fact anything that can be represented by
an electrical voltage can be converted and used as a digital
signal. These signals could be something as simple as setting the
level of light in a room, or as complicated as controlling a car's
engine when you push the gas pedal.
For more on these A-D and D-A conversions check out these articles:
http://en.wikipedia.org/wiki/Analog-to-digital_converter
http://es.wikipedia.org/wiki/Conversión_analógica-digital
http://en.wikipedia.org/wiki/Digital-to-analog_converter
http://es.wikipedia.org/wiki/Conversor_digital-analógico
So once a digital recording device has done an analog to digital
conversion on a voltage signal, it needs to store that data digitally,
even if only for a moment while it is transfered to another device, in
general this is called Quantization (http://en.wikipedia.org/wiki/Quantization_(signal_processing)
http://es.wikipedia.org/wiki/Cuantificación_digital).
There are many ways to do this, but the most common one used for audio
is called Pulse-Code-Modulation.
http://en.wikipedia.org/wiki/Pulse_code_modulation
http://es.wikipedia.org/wiki/Modulación_por_impulsos_codificados
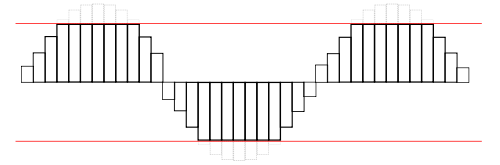
Pulse code modulation works by taking a sample at a certain rate (a set
of pulses every X microseconds) and storing the value as a "code" on a
scale.
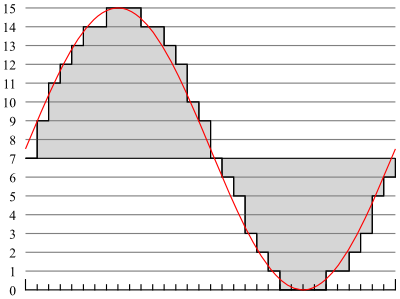
Here you can see an example voltage curve in red. The line in
gray symbolizes the respective coding for the signal (on a scale from
0-15, 4-bit). Each hash mark along the bottom is one time
step.
Here's another example, from the same 2kHz tone that we used
above. This time the graph is only about 1/1000th of a second
long (0.001 seconds). Each point that you see on the graph is where a
sample of the audio was taken.
Bits Per Sample
One of the factors that determines how good a digital audio file sounds
to a human ear is the number of bits used to store the value of the
voltage that was converted to a digital signal. This is often referred to as the sample depth. When we worked
with images, we used 8-bits for each of our three color channels
(24-bit color). Here the most common format you will see is
16-bit which gives you 2^16 or 65,536 different possible values for
each A-D conversion. This is what is used in things like CDs and
iPods, however when audio professionals work in recording studios, they
often use 24-bit values (2^24 or 16,777,216 possible values) for richer
sounds. Using less bits will sometimes cause the audio to not
re-produce the sounds very well because anything that falls outside the
range of values will be clipped off.
Here's an example of clipping:
You can see that that the data that falls outside the values that can
be represented isn't correctly re-produced. This can then sound
like noise or muted sounds in your audio recording.
In addition to 16 and 24 bit storage, there is a method of storage called
"floating point". Floating point takes up 32-bits per sample, but
is used differently. 24-bits of the data are used to store a
value for the sample, the remaining 8 bits are used as an exponent.
This means that floating point values can represent extremely tiny
changes in value that are close to zero. It also means there is
effectively no upper boundary on the scale (in either the positive or
negative direction). An example of this can be found in the
image of the 2kHz tone above in the PCM section. Notice that on
the left, the scale goes from -1.0 to +1.0, instead of something like 0
to 65535. This is the typical way that floating point
values are written. In floating point, the signal is free to go
above 1.0 or below -1.0 without loss (there is no clipping in floating point). Because of this, floating point
values are often used during the recording and/or editing process.
Sample Frequency
The other major component that affects how a digital audio recording
sounds is the number of A to D samples that are taken every second,
also know as the frequency. This number is usually denoted in
Hertz (Hz) which simply means "cycles per second". The most
important aspect to choosing a sample frequency is the Nyquist
theorem. The Nyquist theorem states that to accurately re-produce
a sound, you need to have a
sample rate that is twice as high as the highest frequency you need to
re-produce. As was explained before, the human ear can typically
hear frequencies up to about 20,000Hz or 20kHz. This means that
the minimum frequency that we need to accurately re-produce sound is
40kHz. However there also needs to be some extra room to filter
out any stray (non-audible) frequencies, so the most common recording
frequencies are 44.1kHz for CD audio, and 48kHz for typical digital
audio. There are also some formats specially designed for
recording that go to 96kHz or beyond, and this is to allow for the
creation of even better filters for the non-audible frequencies.
Just because it takes at least 40kHz to accurately record everything
the ear can hear doesn't mean that lesser frequencies are not in
use. For example on telephones any time a land-line call
goes outside the neighborhood or any time on a cell phone the audio is
digitized at an 8kHz frequency. This sounds alright when you just need
to hear what the person on the other end is saying, but would sound
awful if you tried to listen to a musical performance digitized at
8kHz. In this day and age however, an audio engineer would only
look at using a sample frequency lower than 40kHz if there were serious
bandwidth or storage constraints. For this course we will use at
least 44.1kHz or 48kHz audio.
Endianness
Endianness is an artifact of the growth of computer technologies in
different organizations at the same time. This refers to the way
bytes are stored in a computers memory. The details of it aren't
important for digital media creation, just know that there are two
different formats: Big-Endian and Little-Endian. By themselves
they aren't compatible, but it is trivial for software programs to convert between them.
Channels
The channels used in digital audio are different from how channels were
used in images. In this case, each channel is a completely
separate recording, that just happens to be set to play back (and is often
recorded) at the same time. The channels are usually used to
represent the direction that the audio can come from.
Stereo audio has two channels, a left channel and a right
channel. This allows for sounds that seem like they are coming
from one direction or the other. CDs and FM radio use stereo
sound. (http://en.wikipedia.org/wiki/Stereo_sound
http://es.wikipedia.org/wiki/Sonido_estereofónico)
The more advanced format is called surround sound, which is generally
listed has having 5.1 channels. The five main channels are
front-left and front-right (these same as stereo, and are used when
there are only stereo outputs available), front-center, back-left, and
back-right. The .1 channel, is called the Low Frequency Effects
channel and is designed for use with sub-woofers that only produce
sounds from 3-120Hz. Because of this low frequency, it is
possible to use a much lower sample frequency with this channel.
However most computer hardware just treats this as its own complete
channel, hence computers that support surround sound are often said to
have six channel sound instead of just 5.1. (http://en.wikipedia.org/wiki/Surround_sound
http://es.wikipedia.org/wiki/Surround)